LUXINSIGHTS DEMO PAGE
See LuxInsights Data in Action
This page demonstrates how to integrate LuxInsights charts and dashboards into your online publications — two ways, zero hassle.
Download as image — Export any chart as a PNG and drop it straight into your portal, newsletter or email. Clean, sharp and ready to publish.
Embed as a live dashboard — Integrate blog-formatted charts and dashboards directly into your publication. Your readers get an interactive, always-current data experience — no extra steps on your end.
Luxembourg Automotive Market New EV [Pure Electric] Car Registrations
In May 2026, Luxembourg's automotive market saw a notable trend in new electric vehicle (EV) registrations, with a total of 1,248 units recorded. The data highlights BMW as the leading brand with 121 registrations, closely followed by Mercedes-Benz and Tesla. The Renault 5 E-TECH emerged as the top model, achieving 87 registrations. The chart illustrates a steady increase in EV registrations over the past 24 months, reflecting a growing shift towards electric mobility in the region. Publication Date: May 2026
Explore full details and insights in the interactive dashboard.
Example using a dashboard to embed online


SVG code
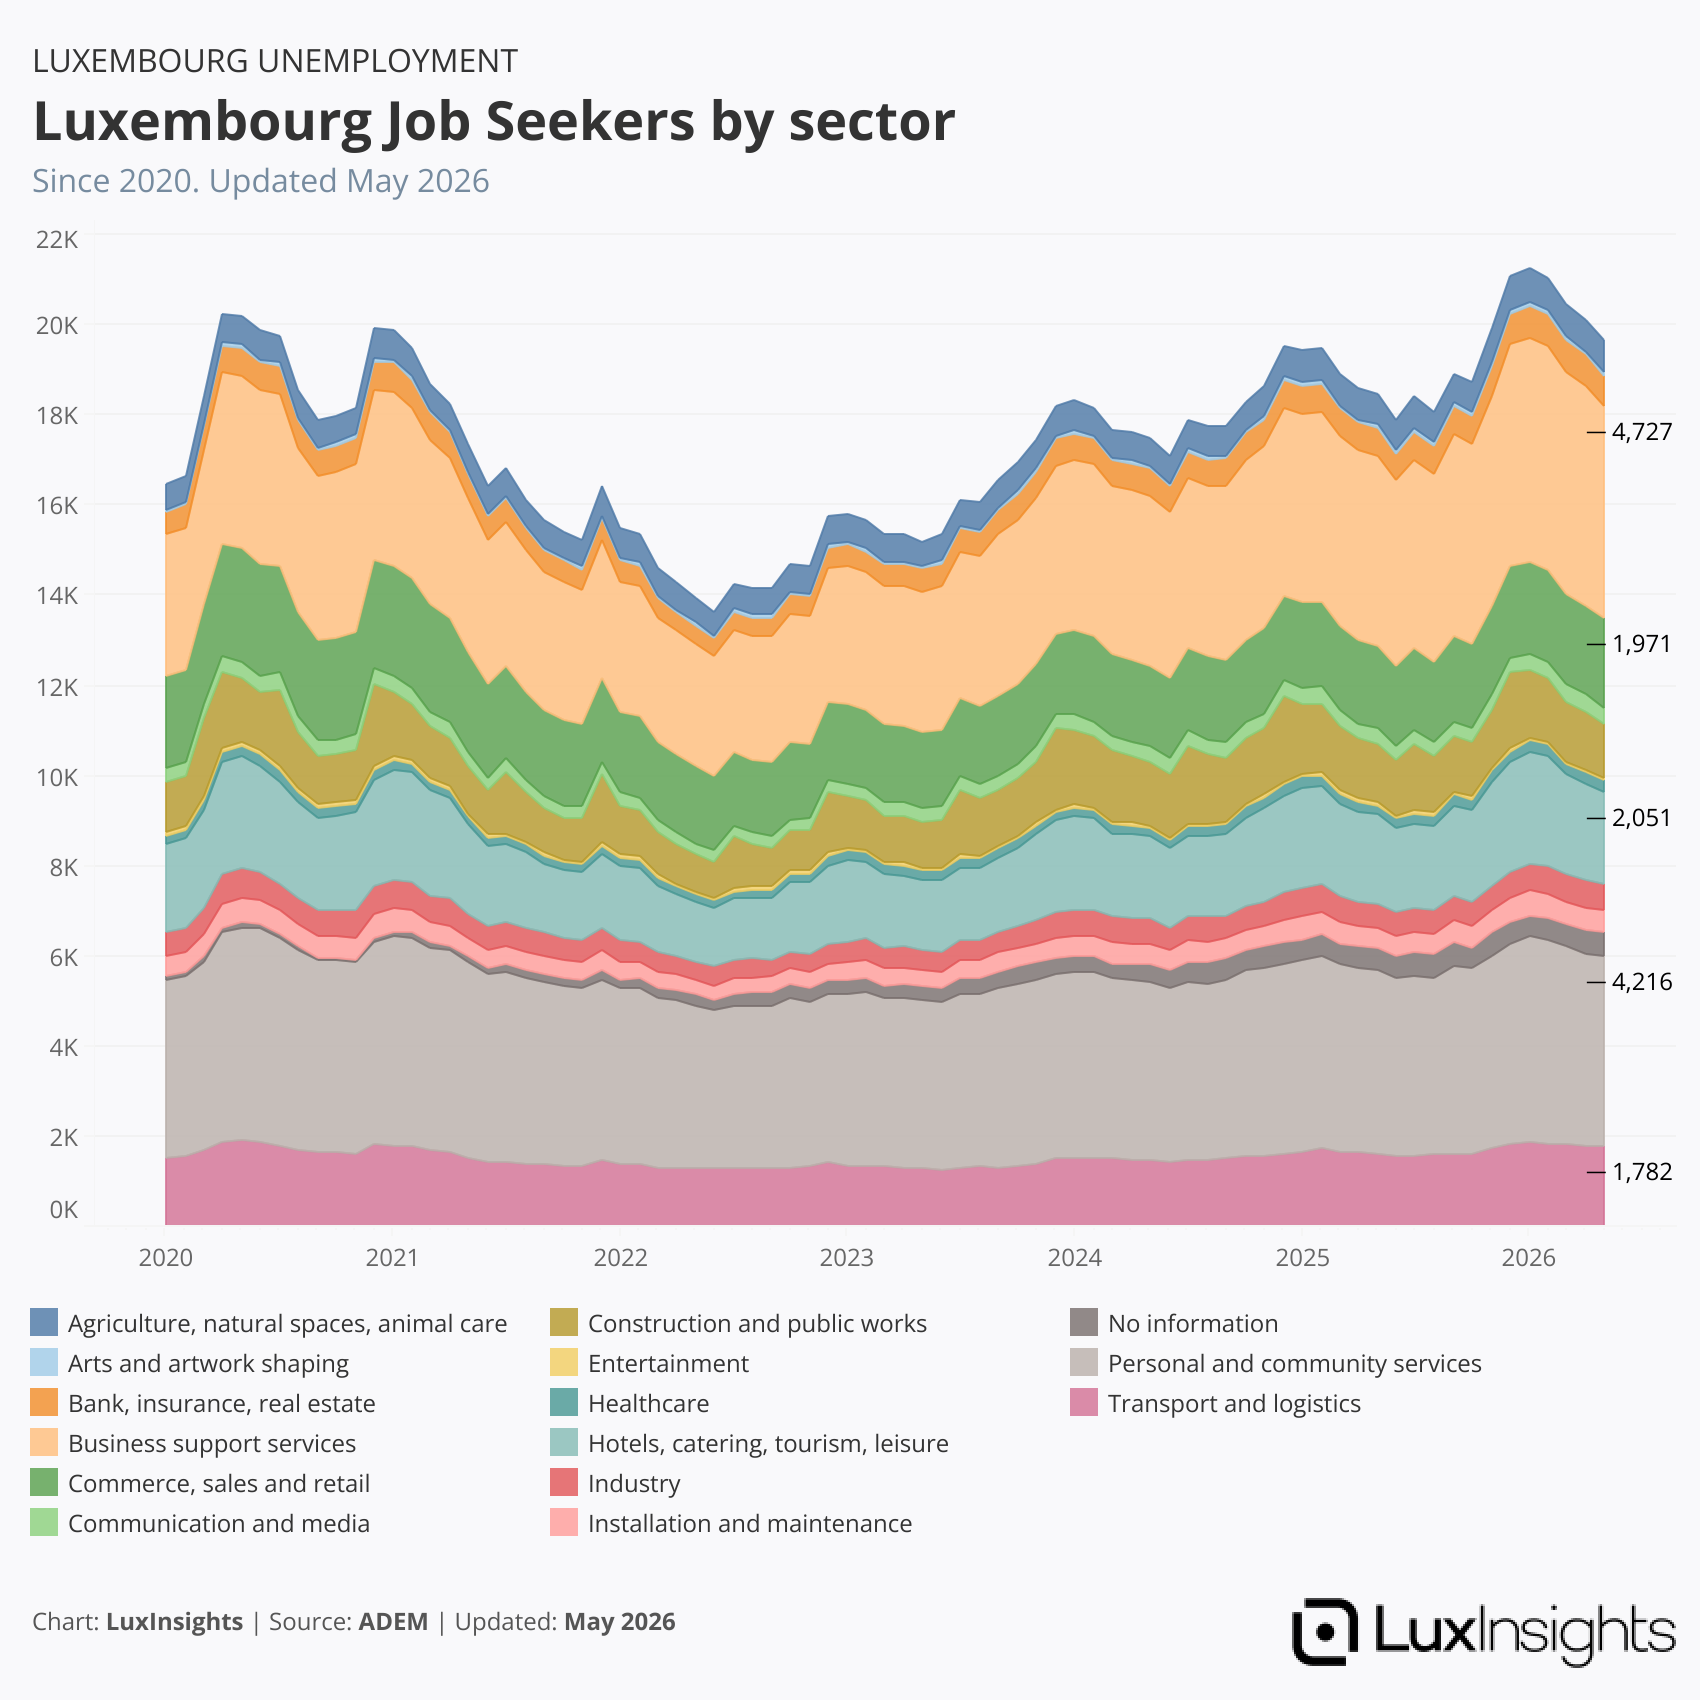
Luxembourg Job Seekers by Sector
The chart illustrates the trends in Luxembourg's job seekers by sector from 2020 to 2026. It features a stacked area design, highlighting various sectors such as healthcare, construction, and entertainment. The data reveals fluctuations in job seeker numbers, with notable peaks in specific sectors. The visualization aids in understanding the evolving employment landscape in Luxembourg, showcasing the sectors with the highest demand for jobs. This analysis is crucial for policymakers and job seekers alike. Publication Date: May 2026.
Example using charts as images to embed in online articles
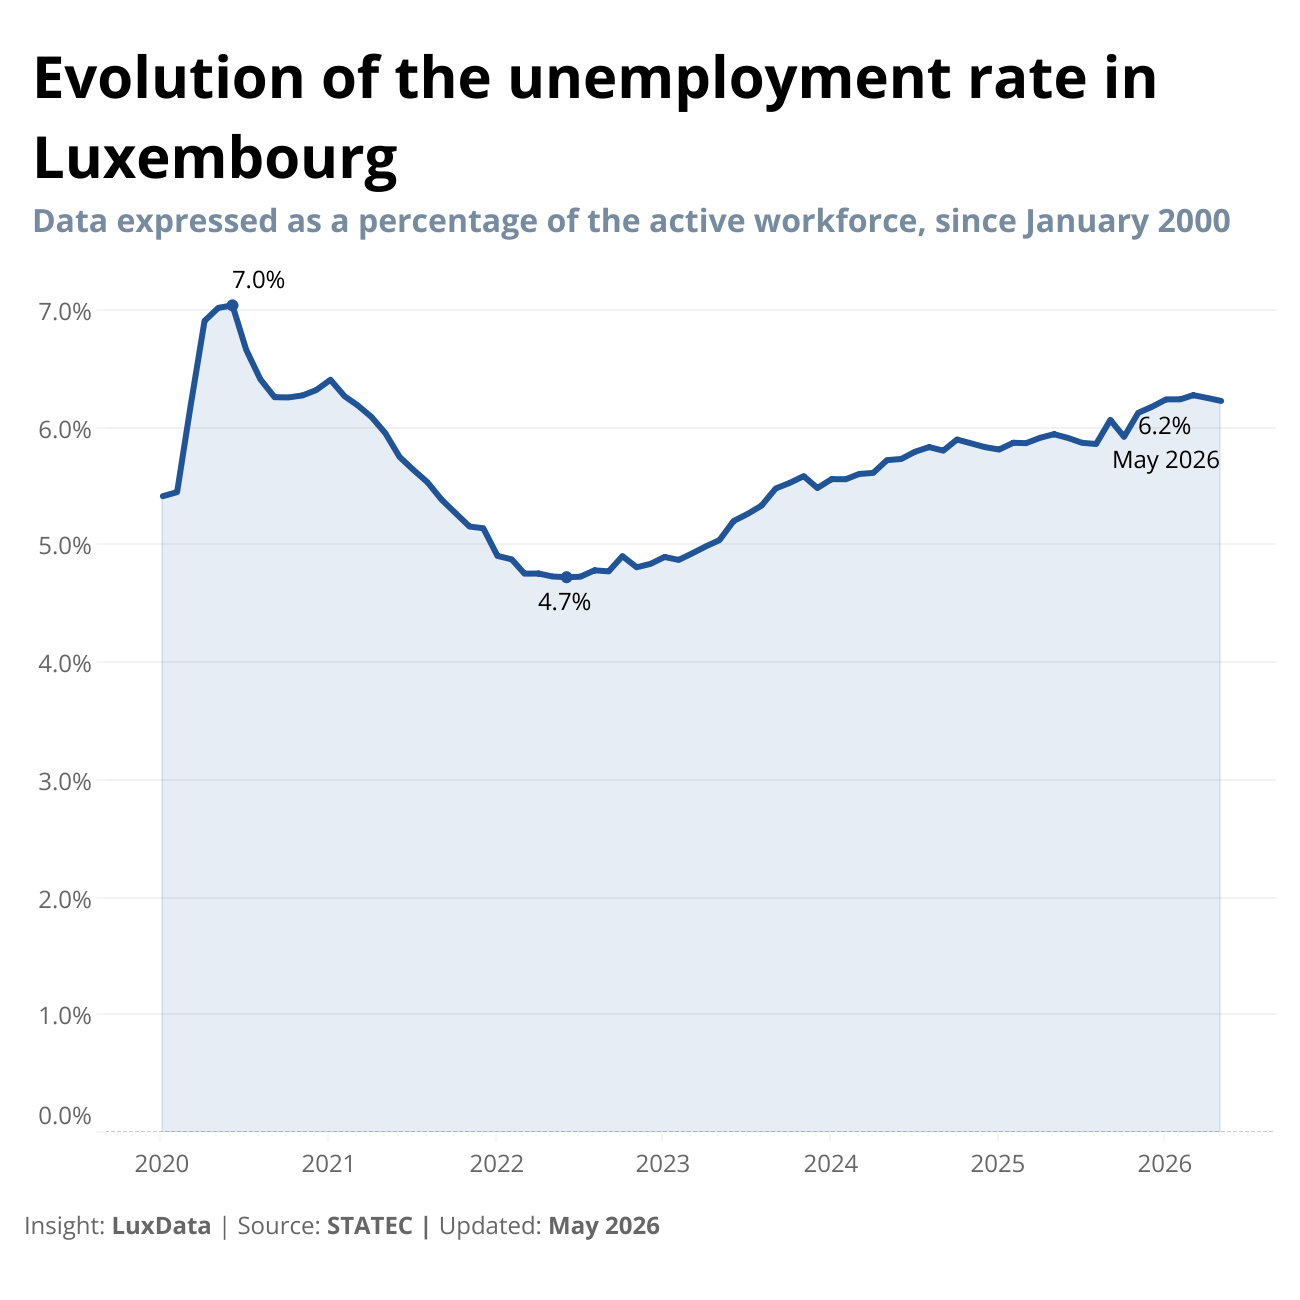
Highlighting a point to tell a story