

LuxData Hits a Milestone of 100 Students Trained
LuxData celebrates a major milestone - 100 professionals trained in Business Intelligence across Tableau, Alteryx, and data analytics programs.
From academic cohorts to professional training environments, our hands-on approach equips future leaders with the tools and thinking needed to turn data into decisions.
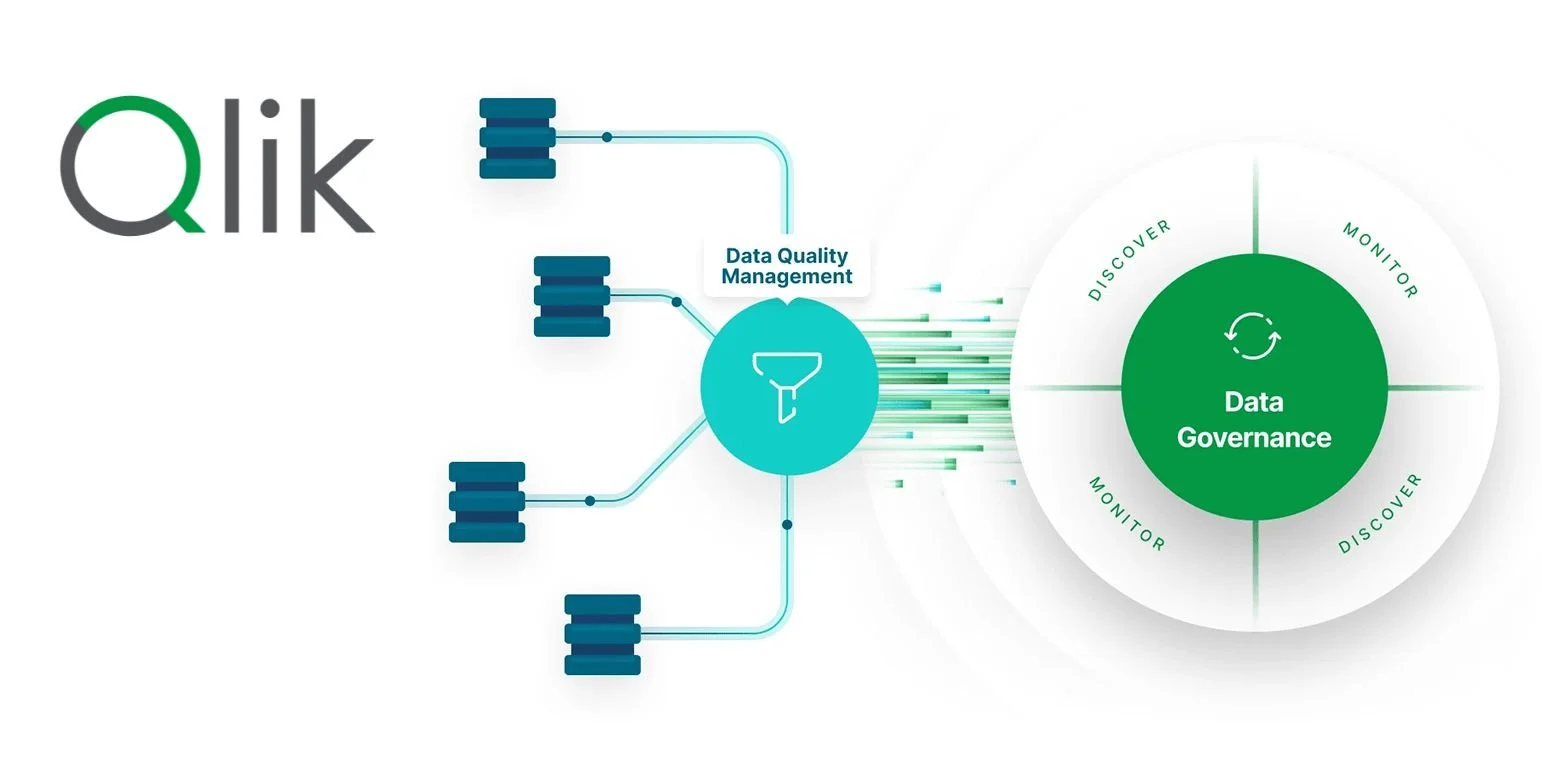
Qlik Dashboard for Air Passenger Complaints Data
Discover how we helped Luxembourg’s National Enforcement Body transform air passenger complaint data into actionable insights. Using Qlik and a centralised data pipeline, we built secure, automated dashboards for internal operations, in-depth analysis, and public transparency - enabling faster decisions, smarter reporting, and greater trust in public services.

Training Courses 2026
Level up your data skills with our hands-on Tableau Creator training at the Digital Learning Hub Luxembourg. Two tracks-Fundamentals (Sept 29-Oct 1) and Intermediate (Oct 27–29)-are designed for professionals ready to master business dashboards and data storytelling. Perfect for new users and team upskilling. Spaces are limited-sign up today.

Tableau Premium On-Demand Support From LuxData
At LuxData S.A., we know that every team learns differently. That’s why we offer flexible training and support formats — from in-company workshops and on-demand coaching to modular micro-trainings that let your people learn at their own pace. Whether it’s improving dashboards, unblocking real cases, or mastering Tableau platform best practices, our expert-led sessions are built to deliver value where you need it most. With flexible support packs, you get premium, scalable help on your terms.

LuxData Becomes an Approved Training Provider
LuxData S.A. is proud to be officially recognized as an approved training provider in Luxembourg, accredited by the Ministry of Economy in 2023. This means that companies based in the Grand Duchy who choose our training services may benefit from government co-funding, making it easier to upskill their teams. Our programs focus on mastering Business Intelligence platforms such as Tableau and Alteryx, with practical, industry-tailored exercises to ensure immediate business impact.

Partnership: Delano & Paperjam Housing Dashboards
We’ve partnered with Delano and Paperjam to deliver a powerful series of real estate dashboards ahead of Luxembourg’s 2024 elections. Covering pricing, availability, and affordability by region, these tools bring actionable insights to citizens, buyers, and policymakers. Explore the full series and see how open data supports smarter decision-making.

LuxData wins 2023 Digital Inclusion Award
We’re proud to announce LuxData has won the 2023 Digital Inclusion Award, presented by His Royal Highness the Grand Duke and Minister Marc Hansen. This recognition highlights our commitment to making data accessible, empowering users through education, and fostering digital inclusion in Luxembourg. Read the press release and celebrate this milestone with us.

Data Studio Now Driving Data Literacy in Luxembourg
We’ve officially launched the Data Studio Luxembourg—a new platform to advance data literacy and digital inclusion through weekly challenges, expert events, and a vibrant data community. Whether you're a professional, student, or policymaker, join us in making data more accessible for all. Visit the website and connect with us on LinkedIn. More coming soon!

LuxData Featured in Luxembourg’s Tech News Outlet
Featured in Silicon Luxembourg, LuxData founder Steve Albrecht explains how the company empowers businesses and the public through data. From advanced analytics to open dashboards, LuxData is building a culture of data literacy in Luxembourg. Read how the Data Studio platform and public data projects are helping unlock smarter, fact-based decisions across sectors.

Luxembourg National Budget ’23 Data Dashboard
This interactive dashboard breaks down Luxembourg’s 2023 national budget by ministry and department, with historical data from 2021 and forecasts through 2026. Built on official data from the Ministry of Finance and the IMF, it offers a clear, accessible view of public spending for analysts, policymakers, and engaged citizens.

Luxembourg Unemployment Insights Data
Get a clear view of Luxembourg’s job market with this interactive dashboard powered by ADEM data. Updated monthly, it breaks down unemployment by sector, gender, region, and age group-providing quick, accessible insights for policymakers, researchers, and business leaders.

Luxembourg Air Quality Analysis Data Dashboard
This interactive dashboard tracks Luxembourg’s air quality from 2018 to 2023, visualizing pollutant levels (NO₂, ozone, PM) across regions using mobile and fixed monitoring stations. Built on open data from the Environment Administration, it offers accessible insights into pollution trends and public health impact.

Transforming Housing Market Data into Public Insight
In collaboration with LISER and SIP, we transformed raw housing market data into an interactive dashboard hosted on Luxembourg’s Open Data Portal. The project focused on public accessibility, accurate visual storytelling, and a sustainable quarterly update process — all powered by Alteryx and Tableau. A smart solution for improving housing data literacy in Luxembourg.

Luxembourg Statistics Data Dashboard
This all-in-one dashboard brings together 25+ open datasets from sources like STATEC, ADEM, and ECB to deliver a real-time snapshot of Luxembourg. Designed for accessibility and insight, it’s ideal for professionals, educators, or anyone who needs reliable national data at a glance. Custom versions available for presentations and business use.

Electoral Participation Analysis Data Dashboard
Dive into the data behind Luxembourg’s 2023 elections with this interactive dashboard. Built for transparency and ease of use, it visualizes voter participation across regions, age groups, and gender-offering quick insights into democratic engagement trends, powered by Open Data.

Operational Analysis of Air Passenger Complaints
Discover how we helped Luxembourg’s National Enforcement Body transform air passenger complaint data into actionable insights. Using Tableau and a centralized data pipeline, we built secure, automated dashboards for internal operations, analytical deep dives, and public transparency — empowering faster decisions, smarter reporting, and greater trust in public services..